We have developed a novel line-scan Raman microscope capable of scanning over a 133x100 μm2 area covering multiple cells in less than 20 seconds with x-y resolution ~0.5 μm and spectral resolution ~4 cm-1. This is 160X faster than the state-of-the-art commercial point-scan Raman microscope using the same scanning step size. We have employed this novel microscope to map oil-producing photosynthetic microorganisms such as microalgae. The aim is to identify and quantify the lipid content in single-cellular (e.g., chlorella vulgaris) and colonial (e.g., botryococcus braunii race B). As shown in the “COST” vs. “GAIN” plot, our line-scan Raman mapping fills in a niche not addressed by current technologies. Maps for a chlorophyll a peak (745 cm-1) and a carotenoid peak (1530 cm-1) are shown in the lower-right figure. Full-range Raman spectra are shown for 3 points marked on the maps. We are currently developing automated processing software and chemometrics to perform “spectral purification” and extract molecule-specific Raman spectra from raw measurements. In addition, we are adding the z-scan capability into current setup with the ultimate goal of 3D molecular profiling at the sub-cellular level without staining or fluorescence reporters.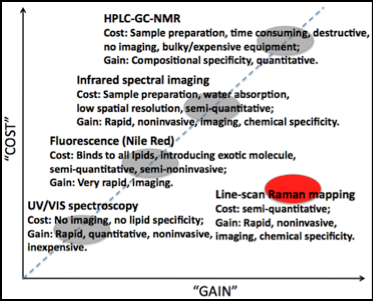
Raman scattering provides molecular “fingerprinting” capability due to the inelastic interaction between incident photon and molecular vibration. Using confocal Raman microscopy to study biological cells in situ is very attractive because molecular information can be obtained without exogenous stains or fluorescence labels [1]. Important examples include the studies of Matthaus et al. on the distribution of intracellular substances at different stages of cell mitosis [2]; the identification by Hartsuiker et al. and Haka et al. of representative constituents in breast cancer [3, 4]; time-lapse Raman imaging of a single lymphocyte by Pully et al. with 2 minute temporal resolution [5]; the identification of bacterial strains in biofilms by Beier et al. [6]; the study of intracellular delivery and degradation of polymeric nanoparticles by Chernenko et al. [7]; the compositional analysis of single microalgal cells [8] by Huang et al.; and, the mapping, by Weiss et al., of hydrocarbon deposits in microalga Botryococcus braunii [9]. The results from these studies show definitively that the mapping of spatiotemporal chemical composition by Raman spectroscopy can enable important discoveries in biology and biomedicine. However, the small spontaneous Raman scattering cross-section of biological samples, coupled with severe limits on laser power density (~2 mW/µm2), leads to long pixel imaging times. In general, at least 100 ms of laser dwelling time is needed for a pixel volume of ~1 µm3 (1 fL). This limits field size, resolution, and the molecular complexity that can be achieved in spatial chemical maps and the temporal resolution of time-resolved studies. These limitations prevent the acquisition of chemical maps from cell population with optimal spatiotemporal resolution.
A high throughput instrument would enable Raman microscopy to become a viable detection and monitoring tool for analysis at cell population level, which could eventually lead to high throughput screening techniques. Recent advances in coherent anti-Stokes Raman scattering (CARS) and stimulated Raman scattering (SRS) techniques provide high-speed image acquisition at selected Raman bands, while plasmonics enables surface-enhanced Raman scattering (SERS) when target molecules are adsorbed on Au or Ag nanostructures [10-12]. However, CARS is limited by non-resonant background and spectroscopic interpretation; SRS is not suitable for full-spectrum acquisition; SERS is a technique only sensitive to surface. In addition to techniques that fundamentally address the intrinsically small Raman scattering cross-section such as the coherent and SERS techniques mentioned above [10-12], an effective solution to the slow mapping speed is through approaches that exploit 2-dimensional detector technology to achieve parallel data acquisition. The approach has been used to improve throughput in slit-scan reflectance confocal microscopes [13] and line-scan fluorescence readers for DNA arrays [14]. In Raman spectroscopy domain, a fiber bundle has been employed as a shape-transforming component to relay a 2D scene onto the 1D slit of a spectrograph [15-19]. Free-space approaches have been implemented by Christensen et al. and Hamada et al. [20, 21]. Recently, we have implemented a parallel Raman microscopy scheme based on active-illumination by a spatial light modulator [22, 23]. An excellent study has been performed by Schlucker et al. to compare point-scan, line-scan and global illumination (GI) schemes [24], among which, the line-scan approach provides the highest throughput when full-spectrum Raman images are acquired. Global illumination, in contrast, acquires narrow-band images within each frame and full-spectrum images are accomplished by scanning a bandpass filter. Strictly, speaking, GI is not a high-throughput technique because out-of-band Raman photons are not collected at each scanning step. GI might have an advantage when only a small number of Raman bands are needed.
In this paper, we demonstrate that line-scan Raman microscopy (LSRM) can enable rapid classification and counting of hundreds of physically similar organic microparticles, as well as screening hundreds of bacterial spores within a manageable time frame. LSRM also enables the study of living colonial microalgal cells at the population and network levels and include the identification of intra and extracellular structural constituents, as well as cell metabolites such as protein, lipids, and hydrocarbons based on their distinct Raman fingerprints.
2. LSRM system configuration and characterization
To fully explore the throughput advantage of parallel acquisition, we have employed the 785 nm output of a continuous-wave (cw) titanium:sapphire laser (Spectra-Physics 3900S) pumped by a diode-pumped solid state 532 nm laser (Spectra-Physics Millennia 10X). As shown in Fig. 1(a), the laser output is transformed by a line-generating optical system consisting of a Powell lens (L1, fan angle 7˚, Leading-Tech) and two cylindrical lenses (L2, 100 mm f.l. & L3, 50 mm f.l., Thorlabs) to form a uniform line. This line is relayed to the side-port focal plane of an inverted microscope (Olympus IX70). A dichroic mirror (785 nm RazorEdge dichroic, Semrock) is placed on the beam path to reflect the laser light. A galvanometric mirror (Thorlabs) is employed to scan and de-scan the line in the transverse direction. Epi-Raman is collected by a microscope objective (60X or 10X) and sent through the dichroic mirror and an additional long-wave pass filter (785 nm RazorEdge long pass, Semrock) for laser intensity reduction, and imaged at the entrance slit of a spectrograph with a CCD detector (Princeton LS785).
Fig. 1. LSRM system configuration and intensity uniformity: (a) configuration; (b) map of polystyrene plate; (c) representative intensity profiles along the projected line and scanning directions.
An essential requirement for high performance LSRM is intensity uniformity of the excitation laser light along the projected line as well as across the scanning direction. We have evaluated the uniformity in both directions using a polystyrene plate. Figure 1(b) shows an x-y map (area 100 m x 100 m) of the strongest Raman peak, which originates from polystyrene ring breathing mode at 1001 cm-1. The standard deviation of the intensity values is less than 0.4% of the average intensity. To better evaluate the intensity uniformity, Figure 1(c) displays intensity profiles along the scanning and the line directions. This confirms that the laser power has been evenly distributed along the projected line. The entire laser line was ~120 m in length, from which the top and bottom 10 m were not used. Thus the utilization percentage was ~85%. This map could also be used for intensity correction across the field of view. The imaging capability of the microscope has been characterized using polystyrene (PS) beads of size from 3 m to 500 nm. Figures 2(a) and 2(b) show the maps of 3 m and 1 m PS microparticles generated using the PS peak at 1001 cm-1, respectively. Figure 2(c) shows the Raman map and intensity response in X and Y direction of a single 500 nm PS bead. The lateral resolution is estimated to be 600 nm and 800 nm in X and Y direction from the full width half maximum (FWHM) of the intensity response, respectively. The spectral resolution is better than 5 cm-1 according to manufacturer’s specifications. The total acquisition time is 2.5 minutes for an area of 100 x 100 m2 using a 0.5 m scanning step size and a 0.75 sec dwell time of the projected laser line. In comparison, it would take ~4 hours to acquire such a map with similar resolution, step size, and power density using a point-scan system. Assuming that 100% of the area in Fig. 2(b) is packed by 1 m PS beads, the equivalent imaging throughput is ~100 microparticles/sec with 0.5 s laser dwell time and 0.5 m step size. The power density has been set at ~3 mW/m2 for sample damage threshold considerations. Typically, the x-direction resolution is comparable for point-scan and line-scan systems as experimentally observed by Schulucker et al. in their comparison of point-scan, line-scan and global illumination systems [24]. For line-scan system, the y-direction resolution is slightly worse than that for the x-direction, likely due to the lack of confocality along the spectrograph entrance slit, which has been observed by us and Schulucker et al. [24].
Pasted Graphic 1
Fig. 2. LSRM system characterization: (a) 3 µm PS beads within a 60 x 100 µm2 area (lower), zoom-in of the upper left corner (upper); (b) image of 1 µm PS beads within a 100 x 100 µm2 area (Three 3 µm PS beads are included); (c) 500 nm PS bead for estimating the lateral spatial resolution
3. Rapid counting and identification of microparticles
One of the most powerful features of chemical imaging is the ability to classify microparticles of similar size, shape and refractive index. Although Raman spectroscopy has been a great tool in analytical laboratories for material characterization, its slow imaging speed has prevented the possibility in counting many microparticles rapidly. To evaluate the capability of LSRM, we have prepared samples of mixed 3 m polystyrene (PS) and polymethylmethacrylate (PMMA) microspheres. Figure 3(a) shows the image acquired using a brightfield imaging channel, from which little difference can be observed among these microspheres. LSRM has been performed over a partially overlapping but larger area of the same sample. Images were generated using the PMMA peak at 813 cm-1 (Fig. 3(b)) and PS peak at 1001 cm-1 (Fig. 3(c)) with the corresponding Raman spectra of these two materials shown in Fig. 3(d). These maps provide unambiguous classification of microspheres of different chemical compositions. Particle counting can be subsequently implemented using thresholding and edge finding algorithms. The Raman data cube has been collected within 100 seconds.
Fig. 3. Rapid identification and counting of microparticles using LSRM: (a) brightfield image of mixed PS and PMMA microspheres; (b) map generated using PMMA Raman peak; (c) map generated using PS Raman peak; (d) Raman spectra of PMMA and P
4. Rapid counting and identification of bacterial spores
A natural application for counting and classification of microparticles is bacterial cell analysis [22,23]. Some bacteria are known to “sporulate” to survive harsh environmental conditions. Therefore, the study of spores is of great interest in microbiology. In addition, it is critical to detect and analyze spores in biofilms in order to develop optimal treatment strategies in biomedicine. Using Bacillus subtilis spore as a model, the brightfield image is shown in Fig. 4(a) over an area of 60 x 30 m2. A corresponding Raman map acquired by LSRM using the calcium dipicolinate (CaDPA) Raman band at 1011 cm-1 is shown in Fig. 4(b). Figure 4(c) shows the full Raman spectra from all the spores with the solid line denoting the mean spectrum and the shaded area 1 standard deviation. Strong Raman bands at 656 cm-1, 826 cm-1, 1011 cm-1, 1395 cm-1, 1445 cm-1 and 1576 cm-1 are assigned to CaDPA and are in good agreement with previous studies [25, 26]. Bands at 1655 cm-1 is assigned to protein amide I. The Raman image consisting of 151 spores was acquired within one hour, or 2.5 spores/min, which is already faster than one of the fastest results at 2 spores/min [25]. LSRM throughput can be much higher with a sample with higher spore coverage. For example, an order of magnitude higher throughput can be easily achieved if the spatial coverage of bacteria is increased from the current value of 8% to 80%.
Fig. 4. Rapid identification and counting of bacterial spores using LSRM: (a) brightfield image of more than 100 spores; (b) map generated using CaDPA Raman peak; (c) mean and standard deviation of Raman spectra of Bacillus subtilis spores.
5. Chemical imaging of colonial microalgal cell using LSRM
Using Raman microscopy to study metabolites, lipids and hydrocarbons in intact microalgae bioreactors has recently attracted significant interest due to the importance of understanding spatiotemporal molecular composition and the associated biosynthesis pathways for nutrition product and biofuels [8]. For example, hydrocarbon botryococcenes are hypothesized to experience multi-step methylation as they migrate from the intracellular space to the extracellular environment [9]. However, such hypothetical pathway is still not well understood because of a lack of label-free molecular imaging technique. Existing mapping approaches are severely limited by slow mapping speed, low signal-to-noise ratio, and interference by strong background fluorescence [8, 9], resulting in unsuccessful Raman mapping results [9]. We have applied LSRM to study the chemical distribution in a colonial microalgae, Botryococcus braunii, B race for the analysis of intra- and extra-cellular lipids and hydrocarbons. This green microalga produce triterpenes known as botryococcenes that can be converted into high octane gasoline, kerosene and diesel fuels. Botryococcenes have unique Raman bands near 1647 cm-1 to 1667 cm-1, while common lipids such as saturated and un-saturated triglycerides, and hydrocarbons have Raman band at 1440 cm-1. The chlorophyll map (Fig. 5(b)) generated from Raman band at 745 cm-1 and carotenoids map (Fig. 5(c)) generated from Raman band at 1520 cm-1 clearly showed the cell morphology. Representative cell boundaries were highlighted using dotted lines. Total lipids shown in Fig. 5 (d) were found both inside the cell and in the extra-cellular matrix. Botryococcenes presented in Fig. 5(e) were primarily found in the extra-cellular matrix, which suggests a more advanced methylation stage of triterpene. The relative amounts of individual can be assessed semi-quantitatively using the colorbar. The entire Raman data cube has been collected within 60 minutes without a pre-photobleaching step.
Fig. 5. Chemical imaging of colonial microalgae using LSRM: (a) brightfield image; Raman maps generated for (b) chlorophyll, (c) carotenoids, (d) lipids and (e) botryococcenes with representative Raman spectrum under each map.
6. Conclusion
In conclusion, we have evaluated the performance of a high throughput line-scan Raman microscope for chemical microscopy of cell population. We have presented detailed system configuration and performed careful characterization for image uniformity and resolution. The overall image acquisition time is significantly reduced by ~100 times compared to conventional Raman imaging methods but provides comparable spatial and spectral resolution. We have demonstrated the rapid imaging capability of this instrument in test involving a) the identification and counting of organic microparticles that appear identical in brightfield image but differ in their chemical signature; (b) chemical imaging of bacterial spores, c) chemical mapping of colonial microalgal cells. These results suggest that LSRM can be a highly versatile tool for studying cells at the population level without the need for labeling.
ACKNOWLEDGEMENTS
We thank Dr. M. Fujita for providing the bacteria samples, and Drs. T. Devarenne and T. Weiss for the microalgae samples. We acknowledge funding from the National Science Foundation (NSF) CAREER Award (CBET-1151154), the National Aeronautics and Space Administration (NASA) Early Career Faculty Grant (NNX12AQ44G), Gulf of Mexico Research Initiative (GoMRI-030), and Cullen College of Engineering at the University of Houston.
REFERENCE
Ji Qi and Wei-Chuan Shih, Performance of line-scan Raman microscopy (LSRM) for high-throughput chemical imaging of cell population, Applied Optics (In Press) (2014).